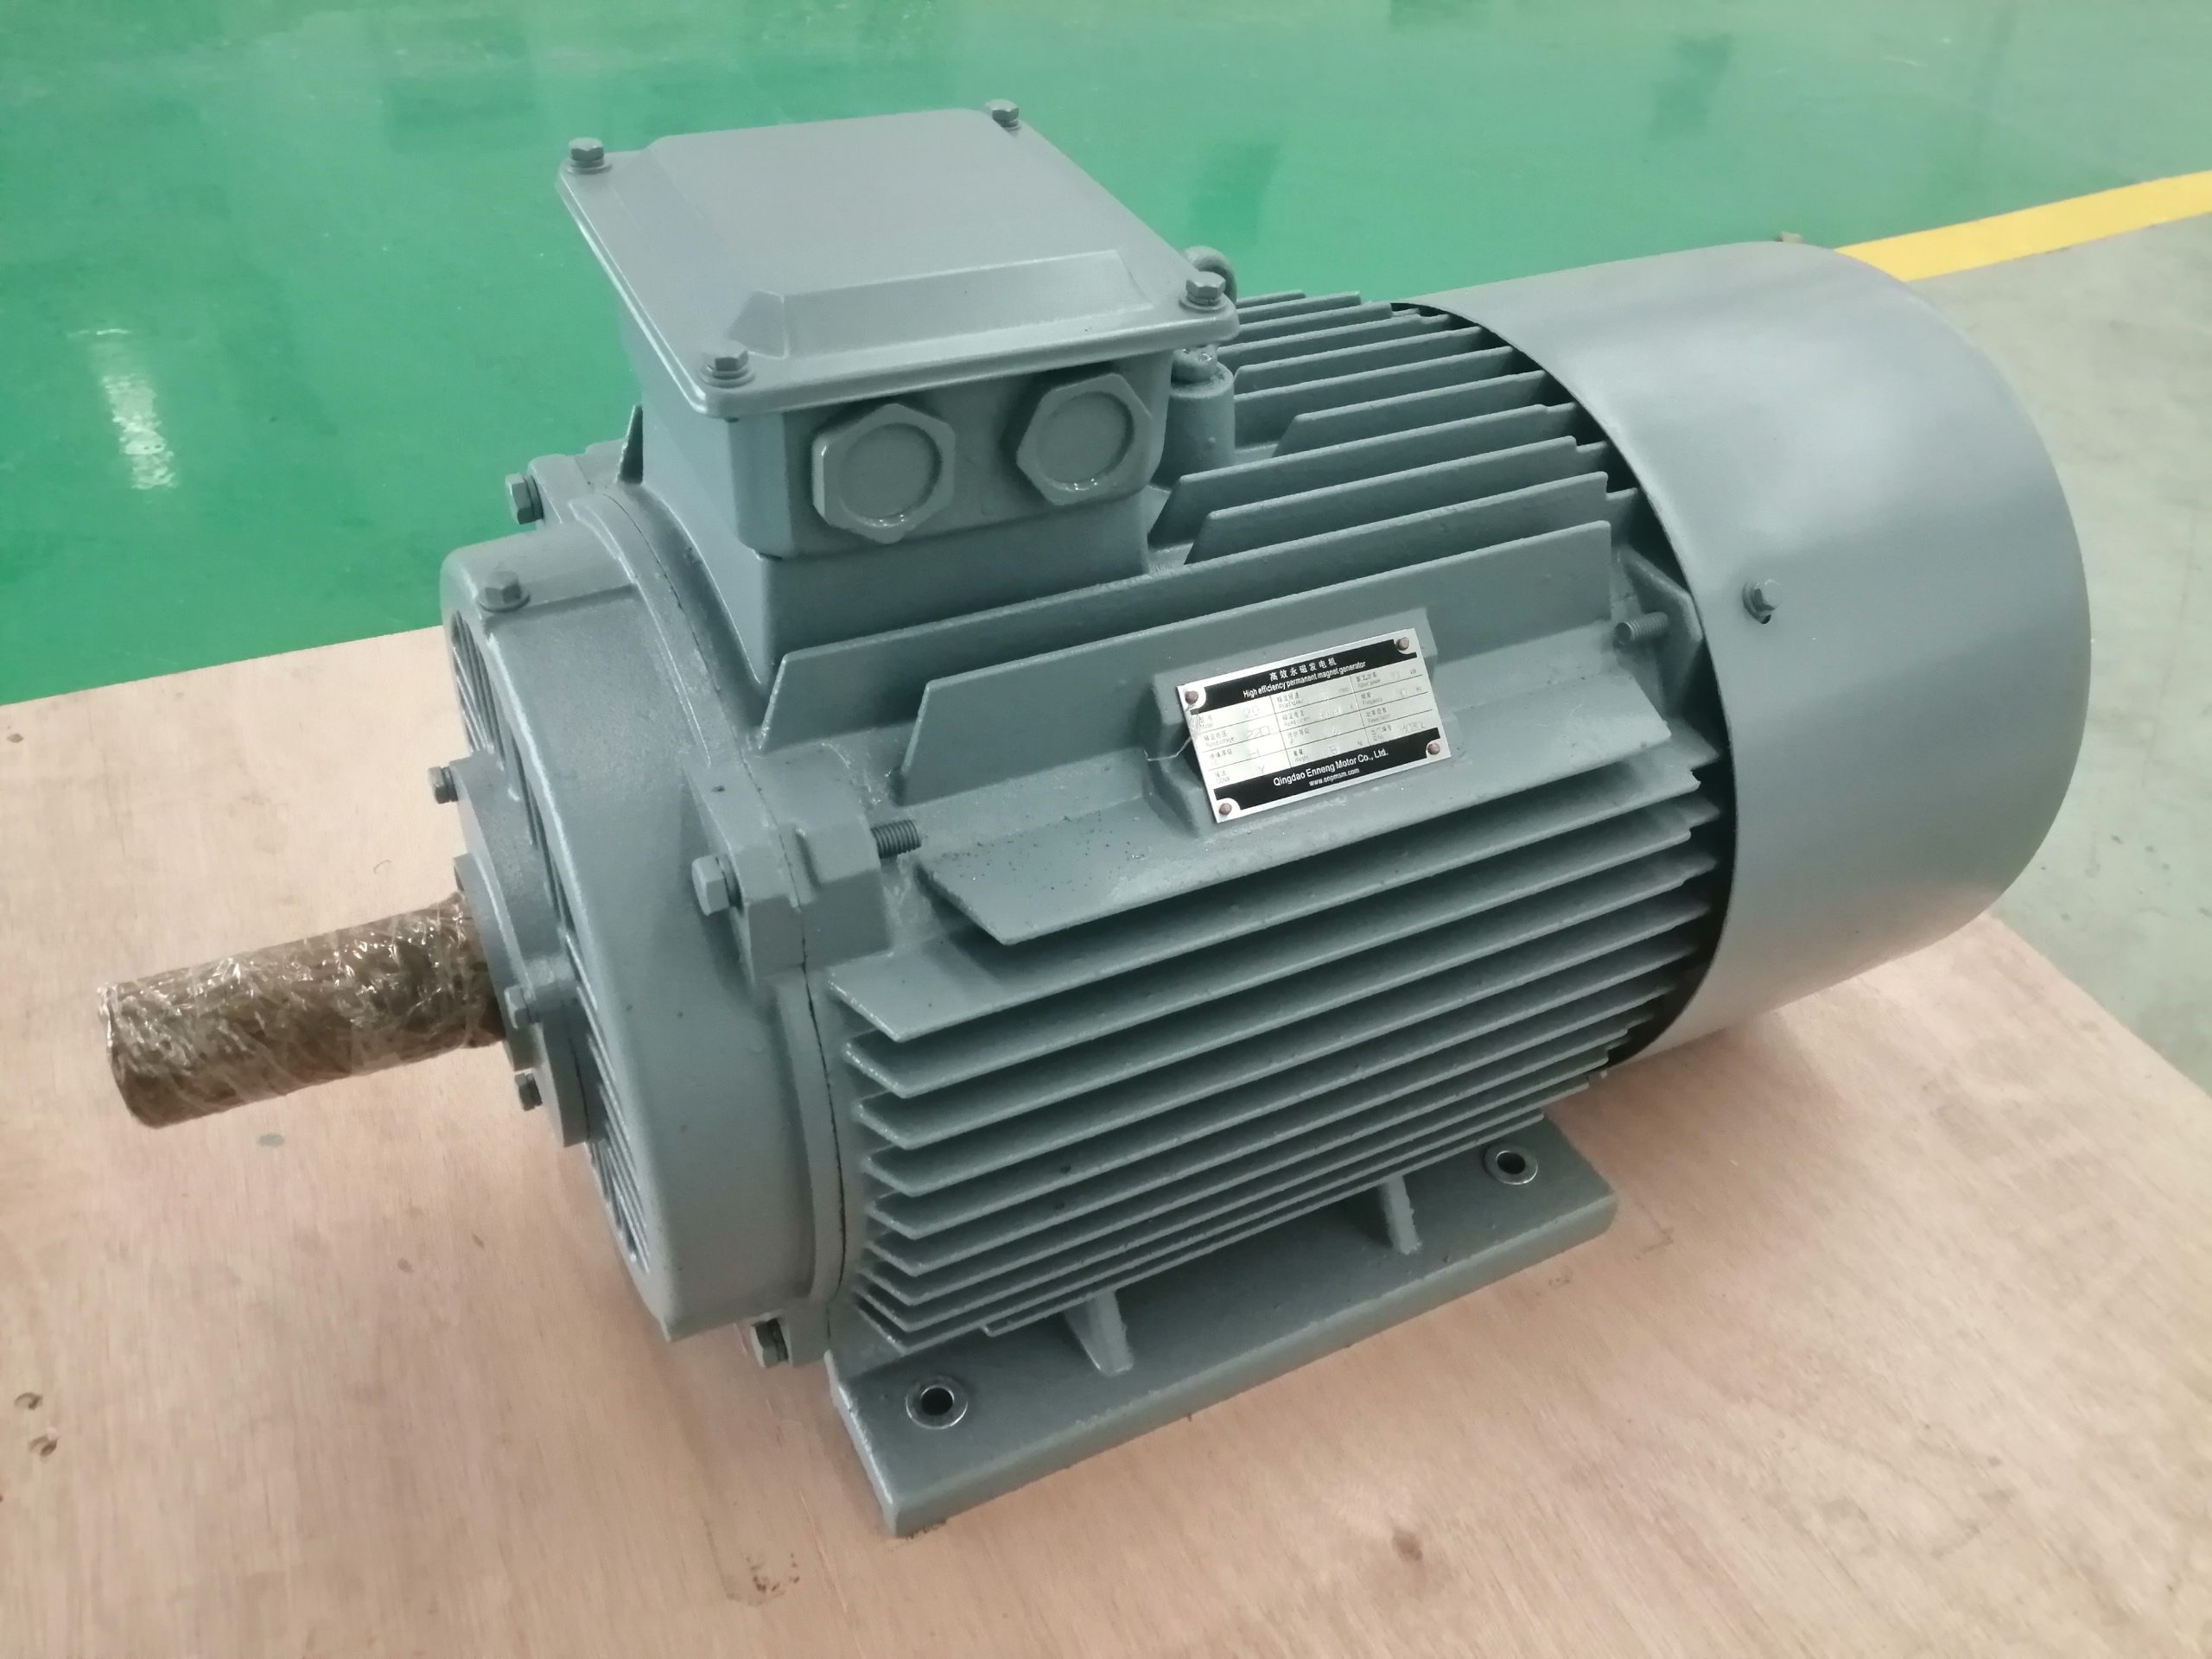
Permanent magnet generator efficiency is not one fixed number that can be compared without context. It changes with speed, torque, temperature, winding and magnetic design, rectifier or converter losses, cooling auxiliaries, and the boundary used for measurement. A quoted peak value may be technically correct while saying little about annual energy production or performance at the customer's real duty. This guide explains how to request an efficiency map, compare complete systems, and write an acceptance test that procurement and engineering can both use.
Define the measurement boundary first
State where mechanical input and electrical output are measured. Generator-only efficiency compares shaft input with electrical output at its terminals. A packaged system may include bearings, cooling fans or pumps, rectifier, DC link, inverter, transformer, filters, and control power. Each added component changes the result. Two offers cannot be compared if one reports generator terminals and another reports grid export or battery input.
Draw a one-line energy boundary and label every meter location. Identify whether auxiliary consumption is included and how it is measured. State AC or DC output, phase arrangement, voltage, power factor, waveform limits, and load type. For variable-speed systems, record converter control and switching conditions. The permanent magnet generator selection guide provides the larger set of mechanical, electrical, and environmental inputs that should accompany this boundary.
Replace a single point with an operating map
List the expected hours or probability at each speed and torque. For wind, hydro, engine, or test-stand applications, the prime mover rarely stays at one ideal condition. A generator can have a high peak efficiency but spend most of its life at lower output where copper, iron, converter, or auxiliary losses have a different share. Request efficiency at representative points across the intended map and state how interpolation or annual weighting will be performed.
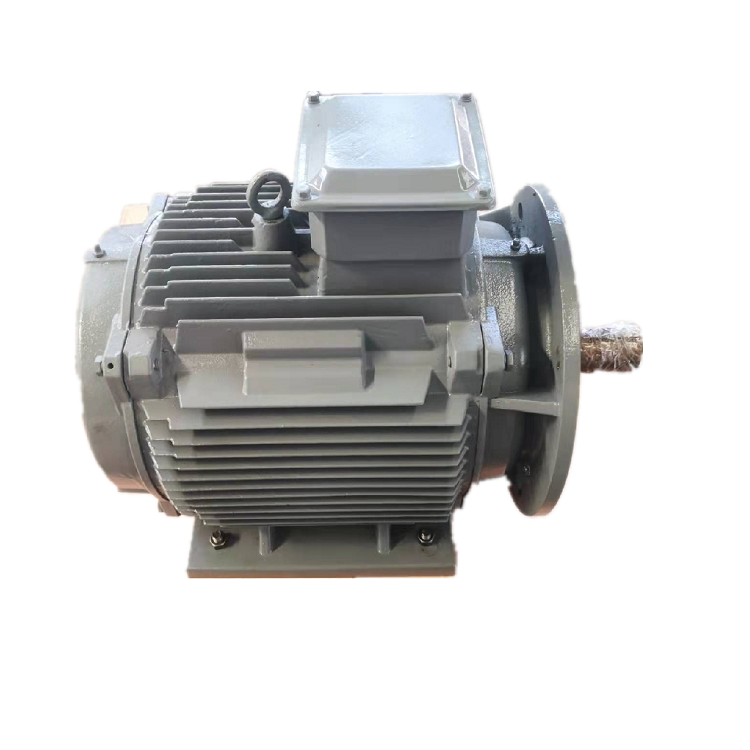
Do not assume rated power is the most important point. Include cut-in or minimum useful speed, common part-load regions, rated operation, temporary overload if allowed, and maximum speed. Record inlet or ambient temperature and thermal stabilization. NREL's official paper on optimized generator designs describes generator sizing as a trade among torque, materials, losses, structural constraints, cooling, and cost. It supports evaluating coupled design variables rather than treating efficiency as an isolated label.
Account for copper, iron, mechanical, and stray losses
Copper loss varies with winding resistance and current, while resistance itself rises with temperature. Iron losses depend on magnetic flux, electrical frequency, material, lamination, and waveform. Bearings, seals, windage, and ventilation contribute mechanical losses. Additional stray and harmonic effects can appear under converter or non-sinusoidal loading. The share of each category changes as speed and load change.
Ask the supplier for the loss model or test method used to create the map and the assumed winding temperature. A room-temperature resistance can make calculated copper loss look better than hot operating conditions. If efficiency is derived from separate loss measurements rather than direct shaft input and electrical output, document those measurements and uncertainty. Avoid adding isolated “typical” loss percentages from unrelated machines; geometry, pole count, cooling, materials, and control all matter.
Include rectifier and converter behavior
A variable-speed PMG often produces voltage and frequency that change with speed. The system may use a diode rectifier, an active rectifier, a DC-DC stage, a grid-side inverter, or another topology. Semiconductor conduction and switching losses, filters, transformer losses, and control power belong in a system-level comparison. Converter efficiency also changes with voltage, current, switching strategy, and load.
NREL's dynamic models for full-converter wind turbine generators describes a permanent-magnet alternator connected through AC-DC and DC-AC conversion, with the full generator output passing through the converter. That architecture illustrates why generator-terminal efficiency alone cannot predict exported energy. The cited model is not a mandatory topology for every project; use the actual rectifier and converter design proposed by the system integrator.
Link thermal design to the efficiency map
Loss becomes heat. Confirm how the generator rejects that heat at low speed, rated speed, overload, and the site's worst credible ambient. Specify altitude, enclosure, contamination, cooling medium, inlet temperature, and available flow. If a fan or pump is powered separately, decide whether its consumption is inside the comparison boundary. A machine that reaches an attractive efficiency only with substantial auxiliary power may not give the best system result.
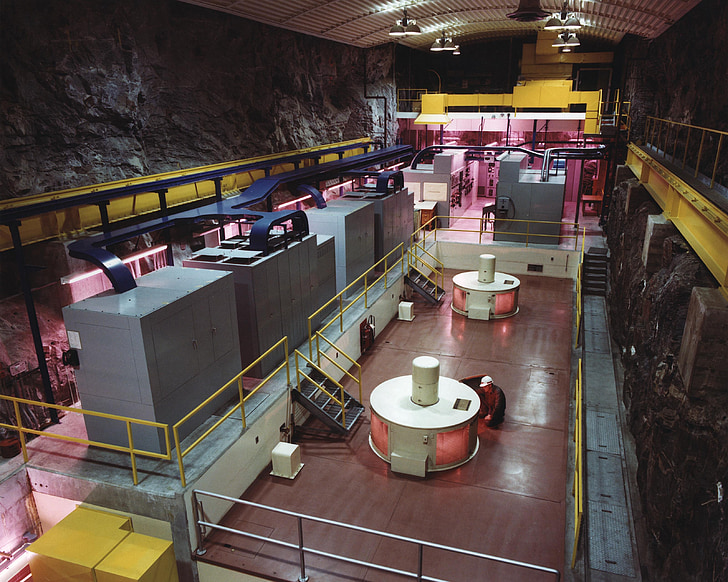
Define allowable winding, bearing, magnet, coolant, and enclosure temperatures as applicable. Ask how the design protects permanent magnets from excessive temperature and how sensors are placed and used. Thermal limits can reduce the continuous operating area even when the electromagnetic calculation predicts more torque. Site acceptance should therefore include enough stabilized operation to validate temperature behavior, not merely a short electrical run.
Match voltage, frequency, and load quality
Efficiency is meaningful only when the output meets the receiving system's requirements. Record terminal voltage across speed and load, frequency where AC is used directly, DC ripple after rectification, power factor, harmonics, and transient response. A resistive factory test load may not represent a converter, battery, grid interface, or nonlinear industrial load. Define the test load and control mode in advance.
The mechanical side also needs limits. Provide prime-mover speed range, torque ripple, shaft loads, overspeed, and torsional information. A direct-coupled generator can remove a gearbox but may require a larger low-speed electromagnetic structure and a different converter. The low-RPM PMG guide explains why pole count, diameter, cooling, bearings, and power electronics must be reviewed together.
Calculate weighted or annual performance transparently
To estimate annual electrical output, apply the site duty distribution to the complete-system efficiency map. Keep the prime-mover resource model separate from generator efficiency so assumptions remain visible. For each bin, use the mechanical input, generator behavior, converter performance, availability, and curtailment rules that actually apply. Show how missing points are interpolated and where uncertainty is material.
Do not turn a modeled annual result into a guarantee unless the contract defines the resource, availability, measurement boundary, and verification method. Report a range when site data are limited. For a retrofit, measure the existing system under comparable process conditions. Changes in wind, flow, head, fuel, product, or control strategy can otherwise be mistaken for a generator efficiency improvement.
Write an acceptance test with uncertainty
The test plan should identify operating points, stabilization, instruments, calibration status, sampling, corrections, tolerances, and the method used to calculate mechanical and electrical power. Torque and speed measurement errors multiply into shaft-power uncertainty. Voltage, current, phase, waveform, and transducer accuracy influence electrical output. Include uncertainty when deciding whether a measured difference is significant.
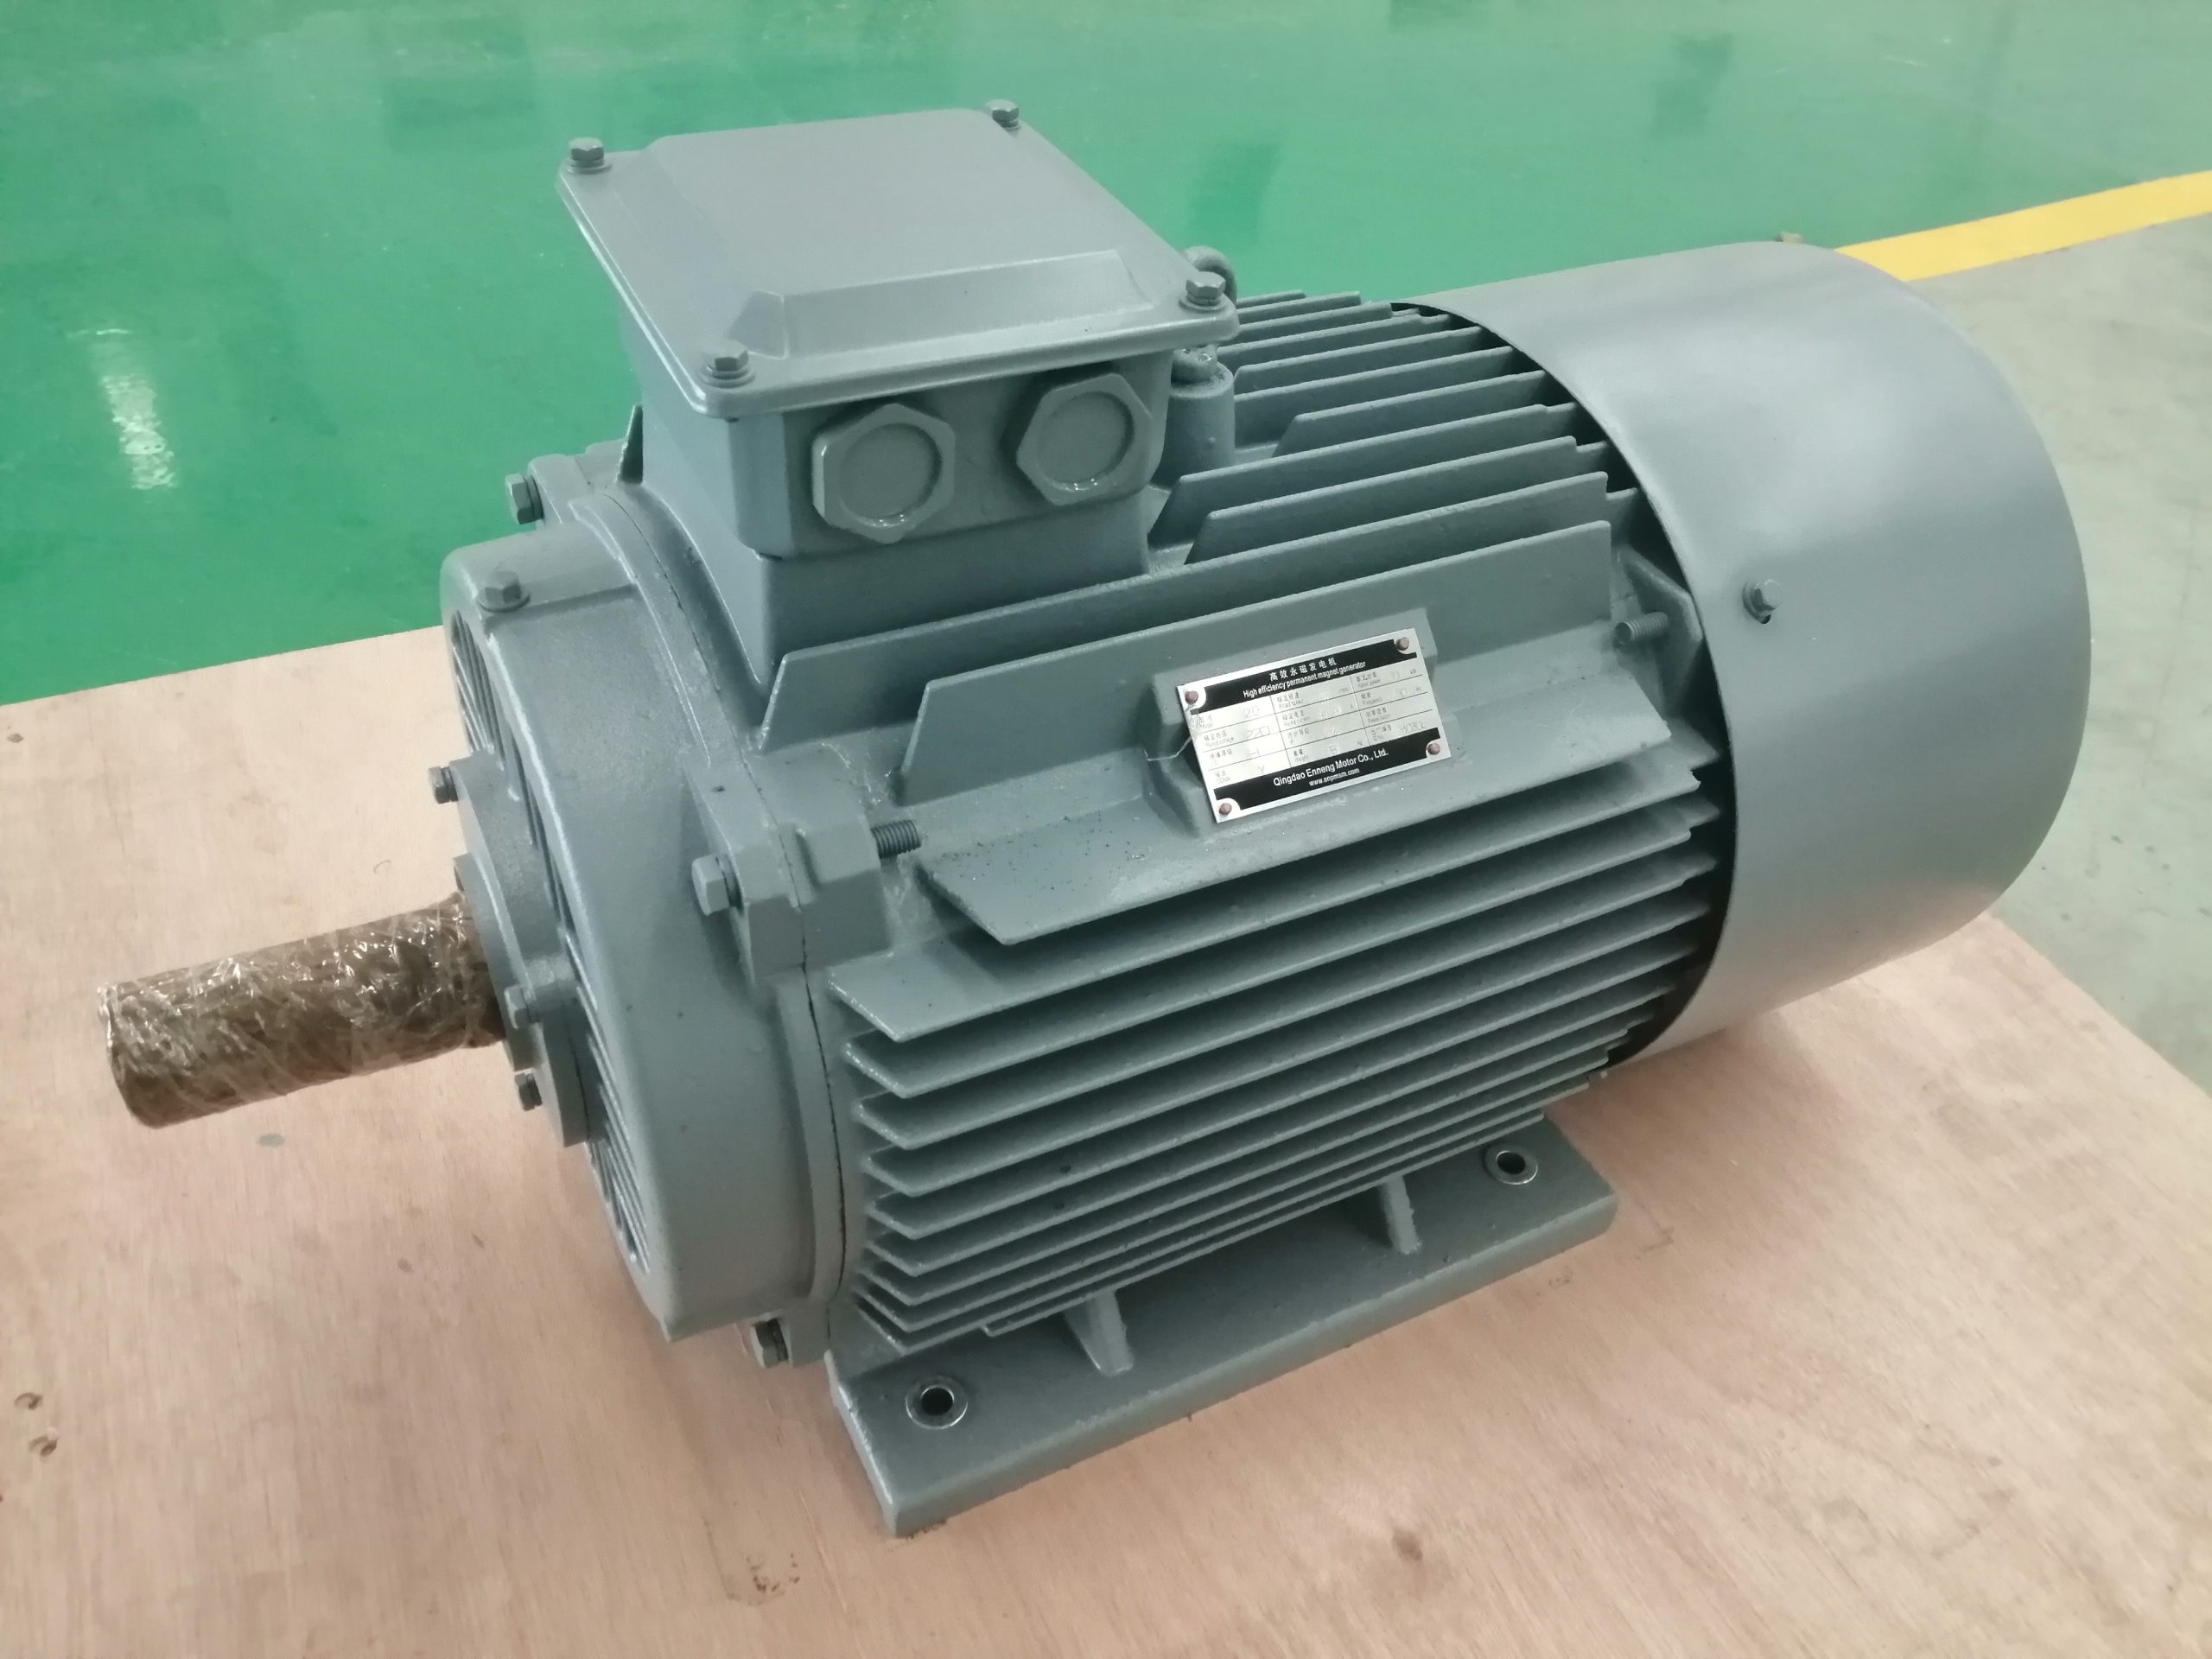
Separate routine factory tests from project performance tests. If the factory cannot reproduce the prime mover or complete converter, agree on component tests and a site test. Preserve raw readings, environmental conditions, control settings, and calculation files. A table showing only final percentages is difficult to audit. The three-phase PMG guide offers related questions on phase, voltage, connection, rectification, and commissioning.
Send a comparable efficiency RFQ
Provide the prime mover, speed-torque distribution, continuous and peak duty, output interface, rectifier or converter, cooling and environment, mechanical drawings, standards, and acceptance boundary. Ask suppliers to return an efficiency map with test or calculation method, temperature basis, auxiliary treatment, and uncertainty. Require a deviation list where the proposal cannot meet a requested point.
ENNENG's archived sources support ENNENG-CAND-007 for the existence of a permanent-magnet generator product activity and ENNENG-CAND-010 for a stated customization service. They do not establish one efficiency value across all powers, speeds, voltages, or cooling arrangements. Review the PMG product overview and send the operating map for a project-specific data sheet and test discussion.
Evidence boundary
General engineering context comes from the two official NREL publications linked above. Those sources study particular wind-generator designs and converter models; they do not certify ENNENG products or predict a customer's annual output. ENNENG candidate records establish only product and customization context. Final efficiency claims require a defined boundary, controlled configuration, approved test method, calibrated measurements, and the actual project duty.